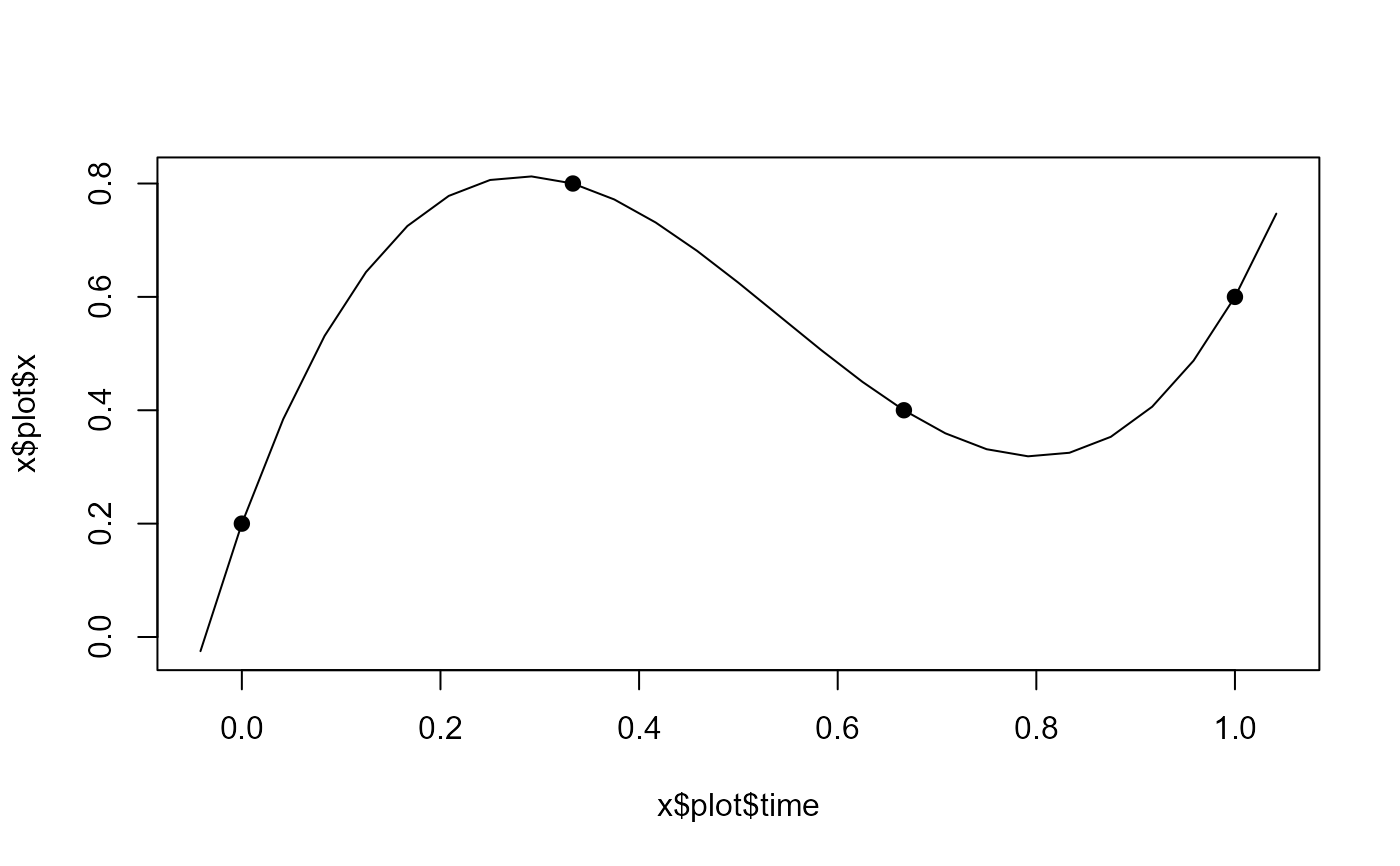
Build a smooth time series from values specified at spline knots. This is useful when a model parameter is allowed to vary through time but is represented by a smaller set of control values to be estimated.
Usage
spline_par(par, n, knots = NULL, periodic = FALSE, period = NULL)

# S3 method for class 'spline.par'
plot(x, ...)
Arguments
- par
Numeric vector of parameter values at the knots.
- n
Number of output time points.
- knots
Optional numeric vector giving the knot positions associated with
par. IfNULL, equally spaced knots are used.- periodic
Logical. Should the spline be treated as periodic?
- period
Optional period of the cycle when
periodic = TRUEand customknotsare supplied.- x
A
spline.parobject returned byspline_par().- ...
Further graphical arguments passed to
graphics::plot().
Value
An object of class spline.par: a list containing the interpolated values
(x), the corresponding time points (time), the knot locations, the knot
values, and auxiliary information used by the plotting method.
Details
The function rescales knot positions internally to the unit interval before
building the spline. If periodic = TRUE, the series is extended so that the
interpolation wraps around smoothly at the boundaries.
The returned object is designed to be plotted with plot() and to provide
both the discrete interpolated values used in a model and a smoother curve
for visual inspection.