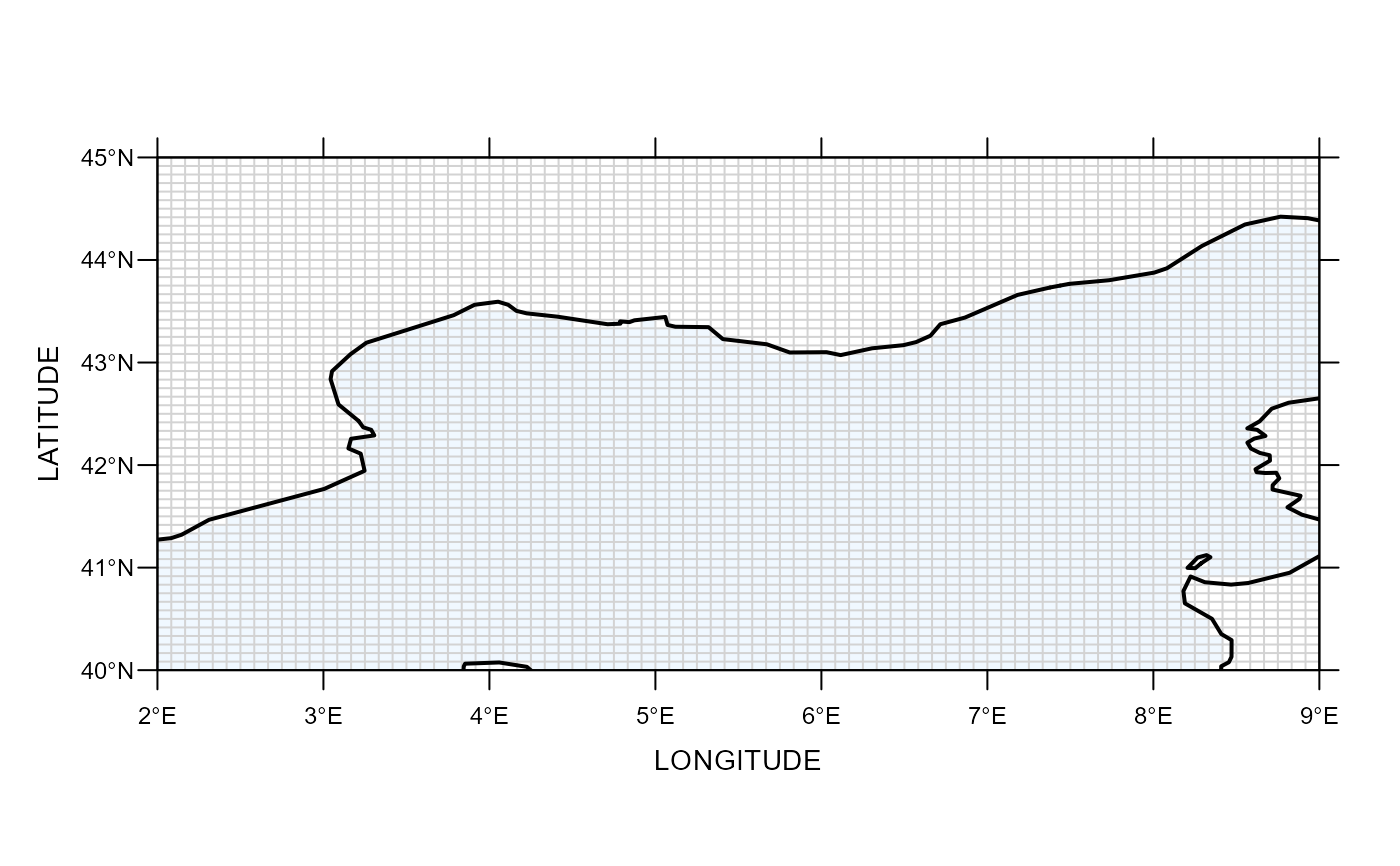
Make a rectangular grid
make_grid.RdMake a rectangular grid
make_grid(lon, lat, dx, dy = dx, n = 1, thr = 0.8, hires = FALSE, mask = TRUE)Arguments
- lon
Longitude of the left and right corners of the grid.
- lat
Latitude of the upper and lower corners of the grid.
- dx
Resolution in the longitude axis (in degrees).
- dy
Resolution in the latitude axis (in degrees).
- n
Number of points within a square to test ocean/land mask. See details.
- hires
Use high resolution coast line? Default to FALSE, TRUE will take considerly longer time to compute.
Value
A list, including the grid and land/ocean mask.
